The Oxford International Standardized Assessments report test-takers’ achievement in three dimensions: subject (e.g. Science), domain (e.g. Physics) and subdomain (e.g. Forces, Motion and Pressure).
At subject and domain level, your results are reported in terms of standardized scores. At subdomain level, test-takers’ scores are assigned to a performance band.
Together, these results let you:
- Compare the performance of each student, class, year group, and school to the typical performance achieved across all test-takers who completed the assessments.
- Understand the level of proficiency each student demonstrated in each of the subdomains assessed.
Standardized Scores
A standardized score is a way to compare a student’s performance to the average scores attained by other students that completed the same assessments internationally.
In standardized scoring, a score of 100 represents the average (mean) score attained by all students in the Oxford International Standardized Assessments (OISA) benchmarking cohort. Scores above 100 represent better-than-average performance, and vice versa.
Based on a cohort average of 100.
- Typical range: 70—130
- Below 70: Well below average
- 70-85: Below average
- 85–115: Within average range
- 115–130: Above average
- Above 130: Well above average
Standardized scoring ensures the OISA results allow a comparison of performance across subjects, even where tests in different subjects contain different numbers of marks, or where tests in one subject are harder than in another. The standardized score always represents performance relative to the whole benchmarking cohort who took the assessments.
To calculate results in OISA, test-takers’ marks are totaled, scaled (to ensure a normal distribution of results around the mean), and standardized (mapped to a distribution where the mean score is equated to a score of 100).
The Oxford International Standardized Assessments use a standard deviation of 15, such that 95% of test-takers in a subject or domain will attain a standardized score between 70 and 130:

Standardization is carried out separately for each subject and for the domains that comprise each subject. The subject mean is not simply an average of the means in each domain within the subject.
Your results reports contain standardized scores for individual test-takers, and average standardized scores in each class/group, year group, and school.
Performance bands
At subdomain level, your results report a performance band indicating the degree of proficiency that test-takers have demonstrated for the given subdomain. The available bands are as follows:
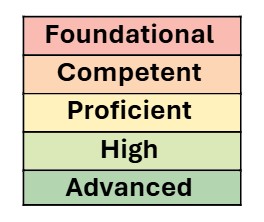
These bands are used to describe how test-takers have performed on questions in the various subdomains that make up each subject. They provide the most granular level of information on a test-taker’s assessment performance.
Whereas numerical scores in OISA use cohort-referenced standardized scoring – that is, they compare each test-taker to the benchmarking cohort’s level of performance, with scores above 100 reflecting above-average performance and vice versa – the proficiency bands are criterion-referenced – that is, they indicate the test-taker’s performance relative to the demands of the curriculum. As such, if (for example) the benchmarking cohort scored very highly on average across a subject, a test-taker whose standardized scores are no higher than 100 could nevertheless be placed in a high proficiency band for many subdomains within the subject. The additional information that proficiency bands thus supply alongside the standardized score is an indication of how strongly a test-taker performed relative to the demands of the assessment (while the standardized score communicates how that test-taker performed relative to the standard of the benchmarking cohort).
The maximum number of raw marks available varies across the subdomains, so the score thresholds for each proficiency band are also variable. As test content is updated each year to preserve assessment integrity, score cutoffs will also vary. Lastly, in order to keep total test time manageable, some subdomains are represented by relatively few questions. For these reasons, we do not publish the specific score cutoffs for each band.
Scores are mapped to the bands so that they broadly reflect the proportion of available marks in that subdomain that the test-taker attained. They can provide a powerful indicator of each test taker’s areas of relative strength and weakness within the curriculum.
Benchmarking data
The Oxford International Standardized Assessments are standardized through psychometric analysis. The standardization process draws on results from 9,645 OISA tests taken during our 2024-25 benchmarking phase.
The results data set was screened to ensure only valid test attempts were included in standardization. The following exclusion criteria were applied:
- Test attempts from test-takers outside the appropriate age range
- Repeated test attempts
- Test attempts from test-takers who did not submit one or more mandatory tests within a subject
- Test attempts in English from test-takers who also sat tests in ESL, and vice versa
- Test attempts containing evidence of potential malpractice
In some subjects, applying the above exclusion criteria resulted in a smaller standardization cohort, and we advise that caution continues to be used in interpreting results from this pilot phase.
Confidence intervals
The following standard error of measurement and test reliability (Cronbach’s alpha) values have been derived following the pilot phase:
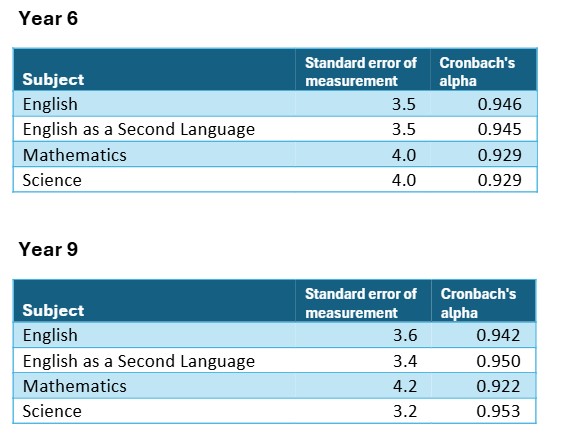
The standard error of measurement can be used to derive a confidence interval around a test-taker’s score, to quantify the statistical uncertainty in the results. An approximate 68% confidence interval is obtained by adding and subtracting the standard error of measurement from the student’s score.
For example, if a test-taker achieved a standardized score of 125 in the Year 9 English assessment, an approximate confidence interval is 125 +/- 3.6 standardized score points, so we can say that there is a more than 2-to-1 chance the test-taker’s true score lies approximately between 121.4 and 128.6.
Standardization will be repeated with expanded datasets as more tests are taken in future years.