Types of Reports:
- School Report: Overview of full school results
- Year Report: Insights split at Year level
- Class Reports: Insights based on the class data imported*
- Individual Student Reports: Insights for the individual student

The School Report provides a high-level summary of standardized scores by subject and year group, including the minimum and maximum scores. It supports broad comparisons of performance across subjects and year levels within the school.
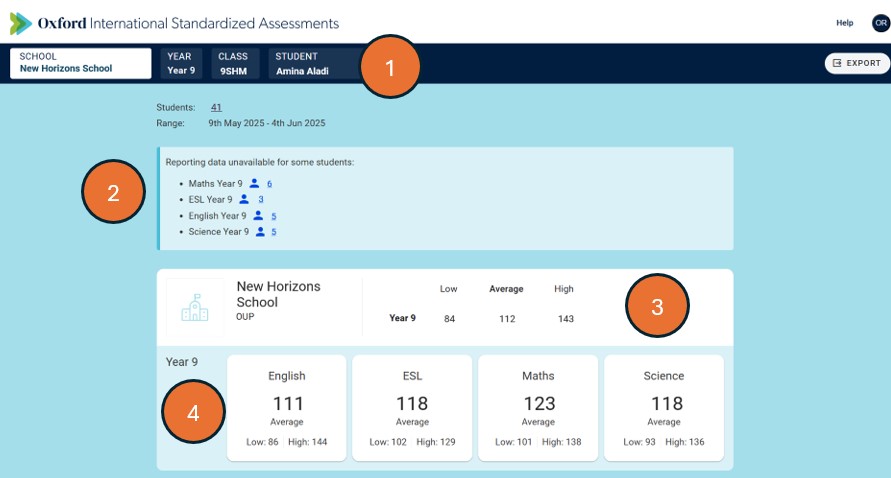
- The navigation bar at the top of the screen allows you to select the level of report you want to view: within your school, choose the year, class, and/or student whose results you would like to see.
- Scope information shows you when the tests reported here were taken, how many students in the school took the test, and how many test-takers at the school are excluded from results (because they did not submit attempts in all mandatory tests within a subject).
- High, low, and average scores across all subjects in the year allow you to understand the range of performances achieved by test-takers in your school. Here, the best result achieved by a Year 9 test-taker was a standardized score of 143 in one subject, while the average result at subject level was 112.
- The tiles toward the bottom of the school report show average, low, and high scores in each of the subjects where students in this school took assessments. Here you can see at a glance that the best average performance was in maths, while students in English attained the lowest average score. English was also the subject in which the absolute lowest score (86) was attained. Click on a tile to jump straight to that year and subject.
Year Report
The Year Report shows assessment results for the full year group across all subjects taken. It includes overall and domain-level standardized scores, and breaks down further to show each class’s average understanding by subdomain. These class-level insights are grouped into performance bands, from Foundational to Advanced, to help quickly identify strengths and gaps across the cohort to support targeted teaching and planning.

- The navigation pane on the left lets you switch between the summary and individual subjects.
- As on the school report, the summary tiles show high, low, and average scores attained in each subject by students at this school in this year. Click on a tile to jump straight to that subject.
- Scroll down (or use the left-hand navigation pane) to view per-subject results for the year.
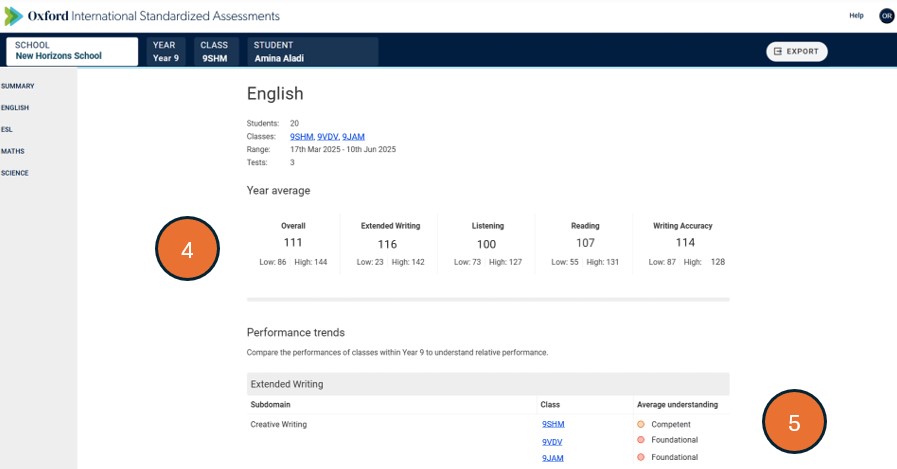
- For each individual subject, you will see average, low, and high scores attained within the year group for each of the domains that makes up the subject. Here, we see a school where the year group on average scored highest in the “Extended Writing” domain of English.
- The “Performance trends” section allows you to compare classes within the year group by displaying the average understanding each class demonstrated in each of the subdomains of the subject.
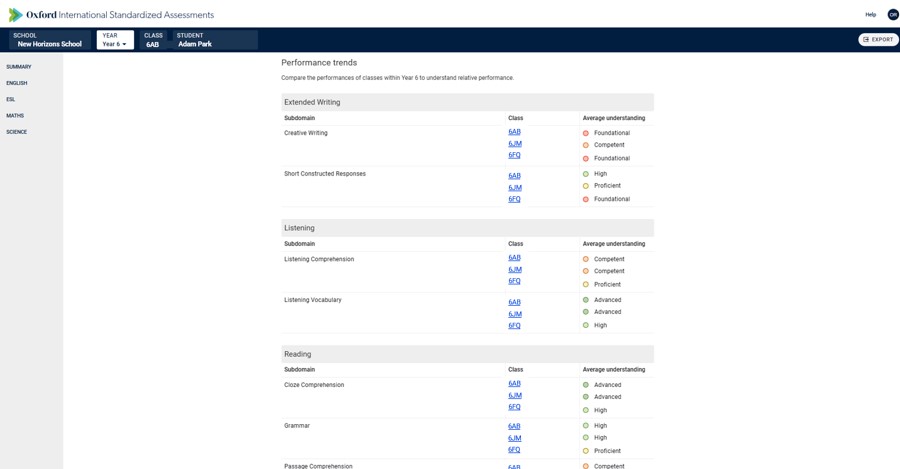
As seen in this example Year 6 report, with performance trends you can quickly identify areas where individual classes excel or may need more support, as well as understanding performance across a subject in all classes. In English, for example, we can see that Year 6 students in this school generally scored higher in reading than writing. Within listening, the cohort generally performed best on vocabulary, though class 6FQ attained slightly below the other two classes. By contrast, for listening comprehension class 6FQ on average slightly outscored the other two classes.
Class Report
The Class Report presents assessment results for all subjects taken by students in a specific class. It includes overall and domain-level standardized scores, with comparisons to the wider year group. The report highlights performance trends by showing each student’s performance band across subdomains and includes a performance distribution chart to help teachers quickly identify how domain-level understanding varies across the class.

- Click on a band within the performance distribution chart to see a list of students whose score fell into that band overall, and for each domain within a subject.
- The red diamond represents the student highlighted in the table below the chart. Here, we see that the highlighted student was in the median band overall for science, and in the median band for chemistry, with a slightly lower score in biology and a slightly higher score in physics.
- Click on another name in the table to see that student’s placement in the score bands.
The table can be used to identify potential groupings of students within the class. Students who appear in the same bands together across domains might benefit from the same teaching interventions.
The chart also visualizes the performance of the whole class. Here we can quickly see that no students attained above the median band in chemistry, suggesting this domain might be a relative weakness for the whole class. Overall (and in biology), the class’s scores are close to the standardization mean of 100. In physics, though, there is a broader spread of attainment, meaning more differentiation may be required in teaching this domain for this class.
Individual Student Report
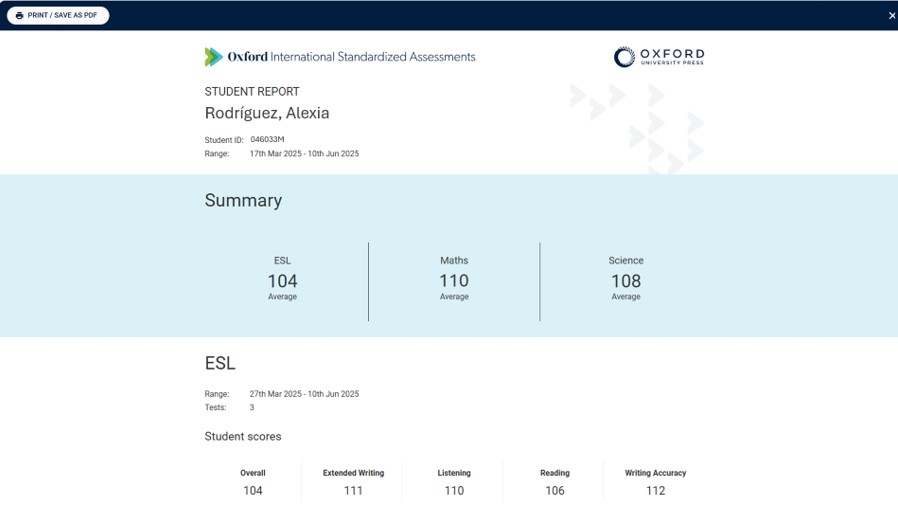
The Individual Student Report provides a summary of a student’s overall and domain-level standardized scores, with comparisons to both class and year group averages. It also includes a breakdown of the student’s performance across subdomains. This report is ideal for saving or printing as a PDF to share with colleagues or parents, with an option to toggle off class and year comparisons when preferred for parent communication.

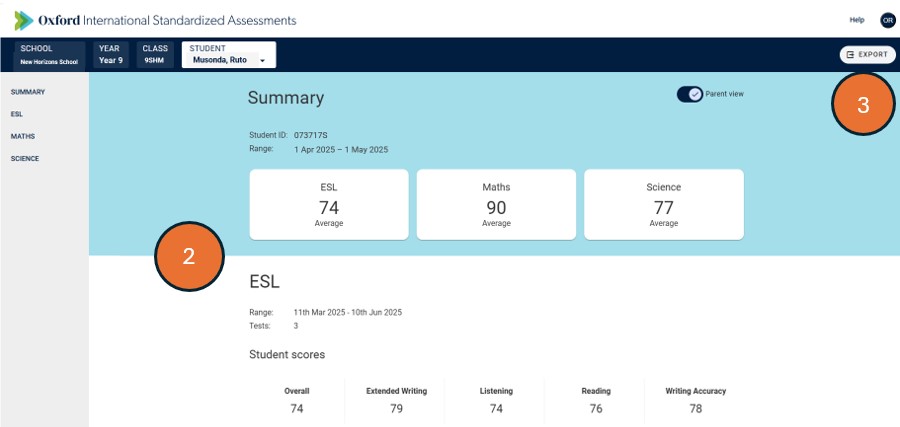
- Click the “Parent view” toggle to remove the lines comparing scores to the class and year averages.
- Scores now appear without comparison values.
- Click “Export” to output a printer-friendly version of the parent or teacher report, ideal for sharing with colleagues or as part of reporting to parents:
You can share this document with parents alongside the student report / certificate to help them understand the standardized reporting.
Omitted Students
If a student at your school was enrolled in an assessment but has not met the criteria for their results to be returned this will be highlighted in a box at the top of the relevant report.
By clicking on the number you will be taken to a list of the students who are omitted from the report including a reason. If a student is labelled as ‘Incomplete’ they have been enrolled in the assessment but have not completed all mandatory papers for the subject, if labelled as ‘Omitted’ their enrollment in the assessment has been cancelled.
At the end of the assessment window any students who are labelled as ‘Incomplete’ and have therefore not met the criteria for results return by the deadline will automatically have their enrollment cancelled and become ‘Omitted’.
